Chapter 1 Introduction
Inflammatory bowel disease (IBD) involves Crohn’s disease (CD) and ulcerative colitis (UC). It generally affects the terminal ileum and the colon but it can involve any segment of the gastrointestinal tract. ulcerative colitis (UC) is a recurrent, chronic and continuous inflammation of the colon and rectum while the Crohn’s disease (CD) is not a continuous inflammation and affects the whole gastrointestinal tract causing transmural inflammation.
inflammatory bowel disease (IBD) etiology is unknown. However, once it has initiated the most prevalent hypothesis of its chronicity suggests an aberrant immunological response to antigens of the commensal microbiome.
To diagnose IBD doctors use endoscopy and/or magnetic resonance imaging and histologies.
Treatments provided for IBD include, noninflammatory drugs, suppressors and biologics, i.e, anti-TNF- anti-interleukin (IL) IL-2, 23, anti-integrin \(\alpha4\beta7\). The therapeutic options can induce remission in some patients, but they often need continuous treatment to avoid recurrence. Nevertheless, many patients are refractory or intolerant to those therapies and need to undergo surgery or other strategies like dietetic and psychological support [1] .
1.1 Inflammatory bowel disease
IBD includes the CD and UC which are characterized by alternating periods of remission and clinical relapse that mainly affect the gastrointestinal tract. CD is a progressive relapsing disease that can affect all the gastrointestinal tract but shows mostly on both terminal ileum and colon with a discontinuous inflammation. UC is a colonic relapsing disease characterized by continuous inflammation of the colon. Both of them have different risk factors, clinical, endoscopic an histological characteristics (see sections 1.1.2 and 1.1.3).
Around 3.5 million individuals have IBD in Europe and North America combined [2]. IBD is more commonly found in industrialized and developed regions, suggesting that environmental factors might greatly influence IBD occurrence. In addition, the incidence of IBD is increasing in areas, such as Asia or Eastern Europe, where the number of cases was relatively low hitherto [3].
The dysregulation of the inflammatory response observed in IBD requires interplay between host genetic factors and the intestinal microbiome. Several studies support the concept that IBD arise from an exacerbate immune response against commensal gut microorganisms. Nonetheless, the disease could result from an imbalanced microbial composition leading to generalized or localized dysbiosis1.
The role of the gut microbiome in IBD is an active ongoing field of research. Several authors are currently studying the alterations reported in IBD of the intestinal microbiome. However, it is still unclear the cause-effect relation between dysbiosis and IBD. Partly due to the multiple variables already identified that have been linked to IBD; for instance, age, diet, usage of antibiotic, tobacco, and socioeconomic status [4, 5].
The relationship between host and microbiome has been proposed to play a fundamental role in maintaining disease. For instance, some Proteobacteria species which have adherent and invasive properties might exploit host defenses and promote a proinflammatory environment, altering the intestinal microbiota in favor of dysbiosis [6].
The epithelium is often damaged and might present ulcers or other inflammation symptoms. A segment of the gastrointestinal tract might recover if the patient receives treatment or due the natural cycles of the disease. But once a segment is affected by the disease it can be considered as involved, as some damage remains even if the tissues is no longer inflammed.
1.1.1 Etiology and pathogenesis
Several mechanisms have been proposed to drive IBD pathogenesis [7, 8]. Some of them are based on a relationship between the immune system and the microbiome [9, 10]. It is also unclear if CD and the UC share the same origin considering their different symptoms.
There is also evidence of some genetic component on the onset of the disease, specially if the disease appears very early (less than 2 years old patients) [11, 12]. Disease can be classified based on age at onset as very early, early or adult on-set disease [12]. genome wide association studies (GWAS) have linked IBD to over 100 genetic loci, including a NOD2 gene, but so far there is not any known mechanism how polymorfism on this genes are driving the disease [13]. On early pedriatic and adult disease the genetic component is lower than on very early on set and it is thought that the environmental factors are the main cause of the disease at those ages.
On the following sections we will explore the role of several of the possible factors involved on the pahtogenesis, starting with the genetics.
1.1.1.1 Genetics
IBD is not an heritable disease, except for very early onset IBD, but it has some genetic influence that predisposes people to have it.
This has lead to look for genetic factors in IBD both on general population and on the early cases. GWAS are one of the most common genetic studies performed, together with methylation studies. To discover through linkage desequilibrium genetic variations linked to phenotypes and regulatory transcription changes, respectively.
With GWAS several allels on protein coding loci have been found, rising to around 300 genetic variants [14]. Particularly, the NOD2 gene is highly relevant for the disease on European patients, as it is a risk alleles for CD loci but show significant protective effects in UC [15, 16]. The mechanism of how this gene protects from UC has not been confirmed yet [13].
Many of the relevant genetic loci related to IBD are not on protein coding fragments of the genome. Recently expression quantitative trait loci (eQTL) particularly showed [11] that locis are on enhancers or promoters like e.g. H3K27Ac or promoter e.g. H3K4me1 marks as found by chromatin immunoprecipitation sequencing (ChIP-Seq).
1.1.1.2 Microbiome
The human intestine is a large reservoir of co-existing microorganisms (bacteria, fungi, viruses, and unicellular eukaryotes) . This microbiome community exerts different functions in the human body influencing nutrients’ metabolism, the maturation of the immune system while suppressing the growth of harmful microorganisms’ [17].
The role of the gut microbiota has been proposed to play a role in IBD pathogenesis. IBD has been characterized by a breakdown in the balance between beneficial and harmful bacteria that are present in the human gut compared to healthy individuals [18, 19].
Indeed, many studies show that patients with IBD have less biodiversity. Biodiversity is measured on \(\alpha\) (alfa) and \(\beta\) (beta) diversity. \(\alpha\)-diversity is a measure of the species present on a single sample and its abundance while \(\beta\)-diversity compares the diversity between samples. There are some reports of taxonomic changes and increase on Enterobacteriaceae sp, Escherichia coli (specially the invasive strain) at the mucosal layer of IBD patients [20]. At the same time there is often a reduction of protective species like Bifidobacterium, Lactobacillus and Faecalibacterium which might be able to protect individuals from mucosal inflammation via several mechanism such as a downregulation of proinflammatory cytokines or the stimulation of IL-10 and antiinflammatory cytokines [20]. Specially Faecalibacterium prausnitzii is one microorganism of interest [21, 22].
In fact, it has been recently proposed that several unique microbial species can distinguish healthy controls from UC and CD patients [23, 24].
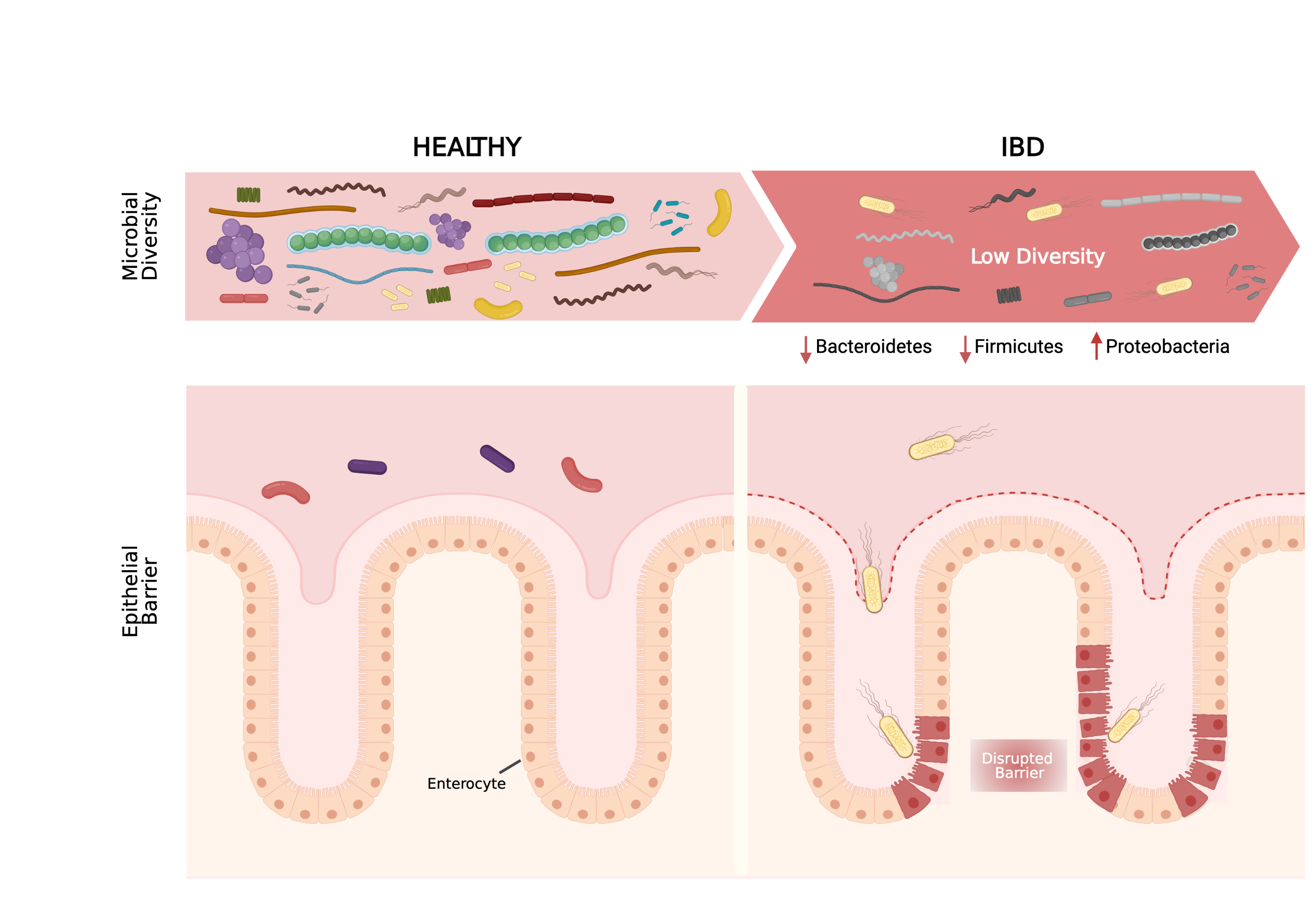
Figure 1.1: Microbial composition of the gut. On the left healthy gut is represented as having a high microbiome diversity and no damage on the epithelial barrier. On the right the IBD gut were microbiome diversity is lower and some bacteria is in physical contact with the damaged epithelium. Adapted with permission from Mayorgas’ 2021.
One of the proposed mechanism of crosstalk between bacteria and host is through bacterial metabolites. They interact with the cells and modulate the state of the intestine. One example of such metabolite is butyrate which has been linked to microorganisms presents on healthy intestines and shown to interact with intestine cells and help regulate some genes [25].
As previously mentioned, adherent invasive Escherichia coli, a proteobacteria specie, has been associated with IBD [26]. Adherent invasive strains are mainly found in ileal and colonic samples of CD patients and their presence in UC is less clear. These adherent invasive cells enter through the epithelium of the more permeable cells and live on their cytosol.
The metabolic cocktail composed of soluble factors secreted by life probiotic bacteria, living microorganisms which, when administered in adequate amounts, confer health benefits on the host [27–31] or any bacterial-released molecule capable of providing health benefits through a direct or indirect mechanism, has been collectively known as postbiotics since 2012 [27].
1.1.1.3 Immune response
As explained previously the immune system plays a role in IBD pathogenesis and pathophysiology.
Loss of tolerance to commensal bacteria has been suggested as the underlying mechanism triggering the inflammation on the intestine. The immune response involves many different cells lines and regions, which are important to know how they organize for a better understanding of the disease.
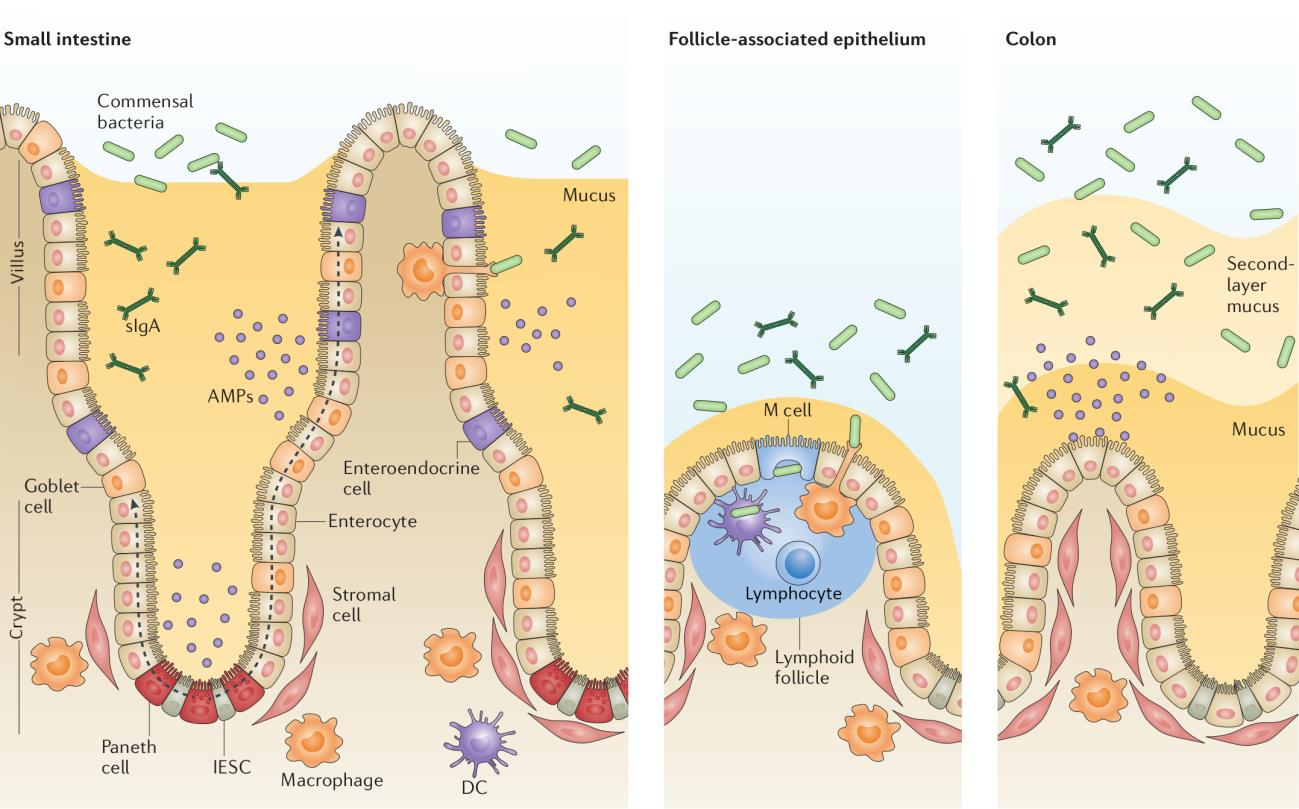
Figure 1.2: The intestinal epithelial barrier. Graphic showing the small intestine with different cells types and the bacteria close to the intestinal epithelial. Adapted with permission from Mayorgas’ 2021 thesis.
From the luminal side of the intestine, the first layer is the mucosa (See figures 1.2 or 1.1). In the colon the mucus is organized in two layers: the inner layer, a firm mucus layer; and the outer, loose mucus layer [32]. The intestinal epithelium is a single layer of cells organized into crypts and villi (and circular folds on the large intestine) that carries out a diverse array of functions besides digestion performed by specialized cell lineages.
Immune response in the intestinal mucous is mainly excreted by the gut associated lymphoid tissue [33]. Genetically predisposed patients when exposed to certain environmental factors activate immune responses against microbials or self-antigens which in turn, may impair the mucosal barrier of the intestinal mucosa, the first physical barrier on the mucosal surface.
Both the adaptive and the innate immune cells are present in the intestine, right below the epithelium. In IBD due to antigen translocation into the lamina propria, the immune response leads the adaptive cells to generate immune response to harmless components of the intestinal microbiota. This initial response induces a local increase in the production of pro-inflammatory cytokines and mediators which damages the mucosa. Therefore, the loss of integrity on this barrier enables the intestinal luminal bacteria to access the intestinal epithelium and to interact with the immune system underneath it more directly [34].
The intestinal epithelium is another line of defense against bacterial invasion. Intestinal epithelial cells play a key role in controlling the integrity of the physical barrier to the intestinal microorganisms [34] not only physically but also secreting antimicrobial peptides and defensins, both of which are altered in IBD patients [35]. The intestinal epithelium also plays a key role on the intake and diffusion of metabolites from the intestinal lumen to the lamina propia.
Damaging or increasing the permeability of the intestinal epithelium results on a response from the immune system. Detecting signals of any foreign particle can also trigger the immune system. On the intestine this starts with the identification of these signals by intestinal epithelial cells have pattern recognition receptors. There are two main pattern recognition receptors: toll-like receptors (TLR), which are present on the surface, and nucleotide-binding oligomerization domain-like receptors (NOD-like receptors), present on the cytoplasm of the cells. These receptors upon recognition of pathogen associated molecular patterns (PAMPs) start an amplifying signaling producing chemokines and cytokines which activates the transcription and translation of pro-inflammatory mediators to ensure an effective immune response. Initially the innate response is triggered but the cells also increase the antigen presentation to T cells and thus activate the immune adaptive response [36].
Other cell types, such as monocytes, macrophages and dendritic cells also present the pattern recognition receptors. From those, macrophages and dendritic cells are antigen presenting cells too and secrete several cytokines to activate other immune cells. Usually CD patients express higher amounts of TLR than healthy individuals, which might trigger a stronger immune response. This response is driven by CD4+ T cells proliferation in secondary lymphoid tissues to T helpers (Th) in the presence of the antigens and cytokines nearby.
Th differentiate depending of the cytokines at which they are exposed. Th type 1 are driven by exposure to IL-12 secreted primarily by dentritic cells. Th2 are driven by cytokines secreted by macrophages. The imbalance between Th1 and Th2-promoting cytokines determines the intensity and duration of the inflammatory response in experimental colitis [37].
Th17-promoting cytokines are less well characterized in human. Treg cells differentiate after exposure to cytokines IL-10, IFN-\(\gamma\) and TGF-\(\beta\). Overall the presence of certain cytokines and the response to self-antigens are factors leads to an inflammation and damage that is related to the onset and establishment of IBD.
On these kind of diseases autologous hematopoietic stem cell transplantation has shown some benefits in IBD [38]. The benefit of hematopoietic stem cell transplant (HSCT) in autoimmunity is thought to originate from the depletion of auto-reactive cells regardless of their specificity. However, due to its associated risk this therapy is only given when patients are refractory to all available therapeutic options.
1.1.1.4 Environmental
Chronic inflammatory disorders and neoplasms have become the main cause of morbidity and mortality in the countries with high standards of personal cleanliness. A decrease in human exposure to microbes or hygene which might affect the proper maturation of the immune system so that it provides less immune response or exacerbated response towards “friendly” microbes [39, 40].
From other environmental factors related to IBD such as tobacco, diet, certain drugs and stress; tobacco is the most influential environmental factor. Surprisingly, it has an opposite effect on UC and CD: in CD tobacco is a risk factor that increases the risk of relapse and/or surgical intervention. In UC, it has been observed that smoking cessation worsens the disease [41].
Pharmacological treatments such as oral contraceptives, non steroidal anti-inflammatory drugs are also related to develop or relapse the disease [42, 43].
The psychological welfare of people also plays an important role in the disease progression, stress, anxiety and depression might be important in relapse and deterioration of the disease [44]. Other environmental factors have been linked to IBD but without enough evidence to support a causative effect in the development of the disease.
1.1.2 CD physiology
As previously introduced, CD is a chronic inflammatory disorder characterized by a discontinuous inflammation of the gastrointestinal tract. Inflammation on the gastrointestinal tract is transmural and can affect from the mouth to the anus, but mainly it manifests on the ileum and colon [10]. It is frequently associated with extraintestinal manifestation and/or concomitant immune-mediated diseases.
The disease itself manifest an heterogeneous symptoms that can involve, diarrhea, weight loss, abdominal pain, fever, anorexia and malaise. Other less frequent co-occurring manifestations are arthritis, primary sclerosing cholangitis, skin disorders venous or arterial thromboembolism and/or pulmonary involvement [45] . These symptoms make it hard to correctly diagnose the disease by non-specialists, in addition there is not a non invasive easy procedure to diagnose it. All these can lead to delays on correct diagnosis of the disease.
The detection of parasites or bacteria, such as Clostridium difficile, have been associated with CD [46]. The detection of fecal calprotectin, is generally a good marker of endoscopic activity with sensitivity above 70% and specificity above 80% [47, 48].
Usually the best diagnosis method is to perform a colonoscopy, whether there is inflammation on the gastrointestinal tract on discontinuous regions then is CD. This inflammation could also present ulceration with rectal sparing and histological lesions which also help to diagnose the patients [49].
Usually on CD a granulome, that is a region with big multinucleous cells, can appear on any intestinal layer. In addition to the inflamed location(s), mosaic zones (patches of inflamed and non-inflamed areas) are more characteristic of CD [50].
The Montreal classification aims to classify patients according to their age of disease onset, standardized anatomical disease location an disease behavior. This classification assumes that the location of CD remains stable over time after diagnosis but behavioral phenotypes change. Other scores consider area affected:
- Montreal classification allows for early onset of disease to be categorized separately those with age of diagnosis at 16 years or younger, diagnosis at 17–40 years and >40 years, respectively [12].
- SES-CD: simple endoscopic score for CD [51]. Score based on size of ulcers, ulcerate surface percentage, affected surface and presence of narrowing on the bowel.
- Crohn’s disease activity index (CDAI): CD Activity Index takes into account weight, ideal body weight, sex, and events on the last week such as liquid stools, abdominal pain, general well-being and if anti-diarrhea drug usage, as well as knowing if there are fistulas, fever, and other complications [52]
To some extent, there is a disassociation between clinical symptoms and the endoscopy finding. Often patients report feeling better despite lack of muscular healing [53]. To overcome this disassociation and be able to compare the well-being of patients several scores and thresholds are used on research and by physicians that will be described later.
In the early stages of the disease the relapsing and remitting course is more frequent. Often relapses are accompanied by clinical symptoms, and few have prolonged clinical remission (without treatment) [54]. When there is clinical remission, there can still remain some other lesions and often subclinical inflammation persists. Frequently the damage caused by the disease evolves to fibrostenotic stricture or penetrating lesions (fistula and abscess).
Damage of the disease might not be apparent to patients and might be only seen several years later than the first detection [53]. Mucosal healing is a first step towards the healing of deeper layers of the inflamed bowel wall on the CD.
Patients might progress from an inflammatory phenotype to a stricturing or penetrating one [12]. Stricturing is a narrowing of a part of the intestine often because of scar tissue and fibrosis in its wall. Penetrating is when the epithelium has some holes or tubes. If these tubes result in an abnormal connection between two body parts it is a fistula, it might also result in an abcess, a collections of pus, often developed in the abdomen, pelvis, or around the anal area.
1.1.3 UC physiology
As previously introduced, UC is a chronic inflammatory disorder characterized by a continuous inflammation of the colon. Depending on the inflamed segments of the intestine it is classified in several phenotypes.
Around a third of the patients with UC suffer proctitis, the inflammation of the rectum. If the segments from rectum to the sigmoid colon are affected is a distal colitis, if it affects the left colon then it becomes a left colitis. If the inflammation continues to the descending colon it is then an extensive colitis until it affects the whole colon when it becomes a pancolitis. The extension of UC is inversely related to the frequency. However, the extension and severity of the disease correlates: the prognosis is worse the more extended it is [55]. In addition, the damage usually consists in many neutrophil in the lumen crypt [50].
The goal of the clinical care is to recover. As a first step, the symptoms of IBD have to lessen to the point that they are mostly absent, gone, or barely noticeable, this is known as clinical remission. However, this is not enough as the mucosa might be still inflamed and thus the reconstitution of the structure and function of the intestinal mucosa is not complete. Other lesions, might aid to the progression to other phenotypes such as fibrostenotic stricture or penetrating lesions or primary sclerosing cholangitis [56].
To prevent and avoid further damage several procedures are followed:
When there is dysplasia, an abnormal development of cells within tissues or organs (which is considered a precedence before colorectal cancer growth [57]), or the damage on the colon has been too big a surgical procedure to remove part or all of the colon must be done.
Patients that undergo a colectomy need to have their bowel reconnected with a procedure called ileoanal anastomosis (also know as J-pouch by the shape it takes) surgery.
Often the lining of the pouch created during surgery becomes inflamed on what is known as pouchitis [58].
Many scores have been proposed for several purposes, from quality of life to disease severity or patient status. Among the scores most used are the following:
Mayo: A score designed to be simple to calculate based on stool frequency, bleeding, mucosal appearance at endoscopy and physicians assessment [59].
IBDQ2: A 32 questionnaire used to assess the quality of life grouped into four categories: bowel, systemic, social and emotional [60].
UCEIS3: An endoscopic score based on vascular pattern, internal bleeding and erosion and ulcers [61].
Other measured parameters include, weight, effective weight, fecal calprotectin, C reactive protein and hemoglobine.
1.1.4 Treatment
Current treatment attempt to induce and keep the remission of patients and reduce secondary effects of the disease instead of revert the pathogenic mechanisms. As standard of care corticosteroids, aminosalicylates and immunosuppressor and some other drugs like antibiotics or metronidazol are util in some cases.
Acid 5-aminosalicylic (5-ASA or mesalazina, pentasa) can be given in a topic way (either liquid, enemas, or suppository) or in oral form (pills or dilutions). In UC it helps in the clinic remission but it does not always mean that there is remission (is twice much likely than placebo to reach remission) [62]. On CD the effects are not so stark and generally it does not produce changes on the disease [63].
Antibiotics, such as metronidazol and ciprofloxacina, are effective to deal with secondary effects of IBD such as abscess and bacterian overgrowth in CD [64, 65], but they do not seem effective on UC [65].
Corticosteroids can be taken orally, such as prednisolona, prednisona and Budesonide; intravenous, hidrocortisona, metilprednisolona; or via enemas and suppositories. Budesonide is not absorved well and has a limited biodistribution but it has good therapeutic benefits with a reduced systemic toxicity in IBD [54, 66]. These drugs work very well as antiinflammatory for mild or severe IBD but do not work well as maintenance drug [67, 68].
Thiopurines (Azathioprine, mercaptopurina) are immunosuppressants drugs that deactivate key process of limphocytes T that might trigger the inflammation. As a side effect they are toxic due to their interaction with nucleic acids [69]. on CD they are useful to induce and keep remission [70], while on UC they are used to keep the remission [71].
In the last two decades IBD treatment has moved from aminosalicylates, corticosteroids and immunomodulators to anti-TNF\(\alpha\). Anti-TNF\(\alpha\) drugs has changed IBD treatment as it reduced the hospitalization associated with previous treatments, reducing medical costs and risk of surgery as well as induce a better mucosal healing and quality of life for patients [72]. However, 20-30% of patients have no response to this treatments and another 30-40% lose response in a year [73].
Recently a new wave of drugs has been developed targeting different molecules such as vedolizumab, targeting anti-integrin\(\alpha 4 \beta 7\), ustekinumab, targeting both IL-12 and IL-23, risankizumab an anti IL-23, tofacitinib an inhibitor of JAKs, infliximab an anti-TNF\(\alpha\).
Patients might become refractory to drug. Thus, drugs do not have the same effect as previously and the dose might need to be increased with the risk of more secondary effects [1]. Surgery resection might be needed on these patients.
Close to 35% of patients with UC will need to have a surgery resection, either due to complications or because the inflammation can not be controlled. Surgery usually removes the inflamed segment of the colon. The most common procedure used is a colectomy (whole colon removal), with ileostomy [74]. CD patients usually require surgery associated to complications like stenosis, abscess, and fistulas ) between 70% and 90% at some point of their lives [75]. Usually the surgery is limited to removing the inflamed segment but occasionally an ileostomy is required [76].
If the drugs fail to contain the inflammation and heal the mucosa doctors might recommend a different procedure. In some cases HSCT is recommended which have shown to improve the life of the patients [77]. This is a new procedure given only to the most extreme cases to reset the immunological state of the patient.
To reset or hugely modify the microbiota fecal microbiota transplantation between different people is currently being explored [78].
1.1.5 Summary
IBD is a complex disease that impacts the health of many people for long time and with lasting impact on their quality of life.
Current clinical care in some cases is enough to have a sustained clinical and endoscopic remission but most often is not enough and relapse is expected. Several factors, such as becoming refractory to drugs, intermittent course of the disease and lack of validated predictors of disease course or response to therapy make the treatment complex.
Lack of knowledge of what are the factors cause of the disease make those treatments and drugs to be addressed to block further inflammation and damage, but cannot prevent it and often they do not stop it completely.
1.2 Integration studies in IBD
Many studies have looked up to the origin of the disease. As seen, one of the hypothesis behind the maintenance of the inflammation involves the microbiome and the host epithelium. This has been studied using several data sources, mostly from sequencing data. The technical methods used to obtain the data of the inflamed tissue differ between extracted from biopsied samples at colonoscopy or from surgical samples.
Those samples are usually used later on to diagnose or for research purpose. To obtain research-quality data it usually imply using techniques such as immunohistochemistry, histopathology, immunohistochemistry, fluorescence in situ hybridization and polymerase chain reaction. These techniques allow to measure or visualize where are the cells expressing certain proteins or genes, thus helping with the analysis validation.
Furthermore several studies have been carried out to discover links between microbiome and the inflammation, followed by those looking for some relationship between genetics and the disease and more recently the metabolome. These studies, known as integration, multi-omic or interaction studies, usually use multiple sequencing assays as the bases of the analysis [79].
However, confirming causal interactions of the variables of each essay is difficult. To find relationships some articles use correlation [80], there are others that use a combination of methods from correlations, partial correlations to integrative methods [81–83] and network integrations [82].
Very rarely there is an experimental confirmation of the relationships between variables of the different assays because it is complicated to test an interaction and to set up the right conditions for the many variables that are accounted for on the integrations. One of the few methods published that shows an interaction between genes and microorganisms in IBD is to expose the ex-vivo sample or cell lines with microbiomes or supernatant of at their culture [84].
1.2.1 Type of data used for integration analysis
According to the data used, we can classify the studies:
1.2.1.1 Transcriptome
Most of the integrations refer some other source of data to the transcriptomics of the patient. The transcriptome of patients derived samples has been extensively studied since the existence of microarrays. There are known marker gens of inflammation and many research focus on identifying prognosis predictors and treatment response prediction based on gene expression [85–87]. Recently single-cell RNAseq technology has enabled to estimate cell populations of the samples with better degree of success than bulk RNAsequencing. Single cell technologies are starting to be used for integration.
1.2.1.2 Microbiome
Many of the integration analysis in IBD are done between host transcriptome and the microbiome. These studies use datasets from IBD patients usually stratified by disease activity or severity of inflammation or location of the disease. Most of them are based on correlation analysis between the microbiome and RNAseq [80]. Conclusions of these integrations range from finding differences on the correlation depending on the type of disease ([80]) to finding relationships with inflammatory genes [81].
1.2.1.3 Genetics
Genetics is the next most common data source used to integrate data in IBD. Most studies on genetics and IBD are GWAS The genetic component is specially important in IBD that starts on children [14, 83, 88].
When using genetic data to integrate it with transcriptomics it is usually to understand how a genetic variant is affecting a gene expression. This has lead to the identification of eQTL [89–92].
1.2.1.4 Metabolome
More recently there have been an increased interest on the study of the metabolic stat of IBD patients, given that microorganisms interact with the host also via their products and metabolites. There is evidence some of these metabolomic products come from the microbiome [25, 84]. Some studies have integrated the metabolome with the RNAseq and state of the epithelium [93, 94].
1.3 Integration
The term “data integration” is widely used with varying meanings. According to the dictionary integration is defined as:
“the process of combining two or more things into one” — Cambridge Dictionary
Other words used are integration, and if specific to data from sequencing technologies, multi-omics or pluri-omics. Here integration will be used as it is the more general one and not restricted to omics or sequencing technologies.
Since the beginning of the integration methods there have been many methods proposed [95]. Some of the early methods were initially used for surveying the agreement of different evaluating systems [96], others were developed for agricultural sciences [97] or food industry [98]. Some of these methods are specific for one application or data type while others are more generally applicable. Lately, the access to bigger datasets with more variables and often from the same samples has increased the focus of the research community on the methodologies available on several disciplines but mainly on biological sciences. The explosion of data on biological sciences has been driven by the new sequencing technologies that allow to measure thousand of variables of many samples at the same time. If done with multiple sequencing technologies it is usually referred as multi-omics methods, which usually only uses omic data.
It is crucial to classify, review and compare tools available, as well as, to benchmark these tools against the same dataset as a way to provide clear recommendations to anyone wishing to use them [99]. Part of these efforts use the methods’ strategies to classify them [100, 101]. Following this view we will review the available integration methods according to several axes: type of data used, aim of the method, relationships between variables, relationships between samples, relationship between variables and samples, input data, mathematical framework and results of the method.
1.3.1 Classification of integration methods
Integration methods have very different properties that allow them to be classified and compared [102]. Here we classify those meant to be used with omics datasets, with references to concrete methodology and in occasionally to articles using them.
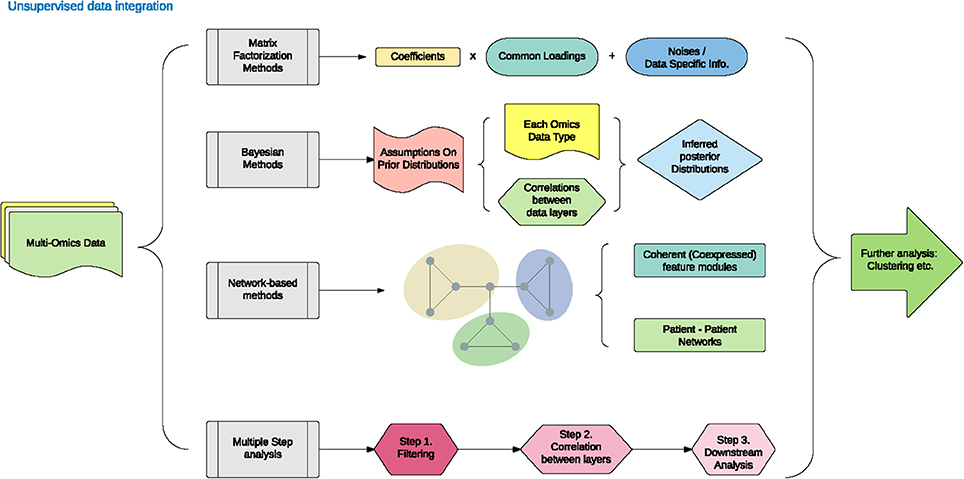
Figure 1.3: Unsupervised data integration methodology. Adapted from figure 1 from Huang 2017.
1.3.1.1 Data type: numeric or categorical
The most important distinction in integration methods is what kind of data are combined. In general data can be divided between categorical and numeric variables, which are usually found in several fields. Sometimes clinicians want to understand the relationship between a phenotype they observe and the underlying mechanism. Usually this involves looking how metabolites, gene expression, methylation, number of variants a gene has, and other numeric variables are related to the observed phenotype (i.e. pain).
Depending on the method’s aim it handles numeric and categorical data types or just one. Often they are used differently. The most common way to handle different types of data is converting the categorical values to a mock or dummy variable. For each categorical factor there is a new variable whose value is 1 if that sample had this factor and 0 otherwise. For instance, if the categorical variable has three values (A, B, C) it would be converted to A (1, 0, 0) B (0, 1, 0) and C (0, 0, 1). Often the number of variables created is one less than the number of factors that existed, on this example only A and B would be kept. This transformation allows to use categorical values as numeric variables.
If the method only accepts categorical data but you want to provide numeric values usually those values are categorized. For example if a variable is (0.123, 0.25, 0.56, 0.78) one could make to categorical values like (“<0.5”, “<0.5”, “>0.5”, “>0.5”). The number of categories to use and how the numeric value splits depends on each case.
Very rarely methods allow to use both data types as they are. If they allow so, it is usually for classification purposes only.
1.3.1.2 Objective
The objective of any method is one of its most important defining properties. Data integration can be classified according to the (biological) question they try to answer. In general all of them aim to provide a better understanding of the relationships between the ’omics types. Often a single method is not enough and several methods are used on the same dataset. This is specially relevant when a potentially relationship between omics is discovered. For instance, checking that in a particular case or condition a given relationship is present, might require experimental confirmation.
Most of the times one (or several) of the following results are expected from integration methods:
- Classification of the patients or samples
One of the purposes of integration might be to use multiple sources of data to accurately describe how do samples or patients fit on a predefined possibles states. The objective here might be to accurately describe whether a patient has one or other related disease of a possible subset of diseases or phenotype [103].
- An overview of the role of each individual omic in a biological system
Sometimes the question is which omic method is the best describing a disease. This knowledge could prevent performing expensive tests and replace them by more affordable or easier technique that has enough predictive power or is sensitive enough and specific for the task. An example of this is the search of markers on blood to identify links between different cell populations [81, 104].
- Finding a molecular signature
A signature is usually a group of features that describe/are representative of a cell type, a process or a stage. Identifying a subset of variables from the omics that are related is often a desired goal because it reduces the amount of variables allowing to perform experiments on the bench on just those that might be important. In other fields, such as machine learning, selecting the important variables is known as feature selection. There are several methods that are used to do this [100]. An example of this is when performing eQTL analysis, where a locus is related to a change in gene expression [89–92].
- A predictive model
Predictive models usually require a very good understanding of the current and/or past relationships, as well as, a good feature selection procedure. If a good model on previous data exists it might be used to predict future events. Sometimes, models are only built to predict events without being able to accurately understand the underlying mechanism. This kind of methods are used to improve treatment selection, diagnosis and prediction of prognosis [105].
- Impute values
Some methods aim to accurately guess the values of missing data given some other information. Missing values can happen for a variety of reasons from practical ones, like a sample not being available, to technical ones, such as laboratory mistake [106]. However, this is often a intermediate step to other goals.
To complete these goals it is important to have enough statistical power to determine the significance of tests performed (if any) and to understand how complete are the data sources used on the integration [107]. Having more statistical power helps identifying the relationships one seeks when using this methods.
1.3.1.3 Relationship between variables and samples
Depending on the amount of variables and samples used in studies can be classified in two types. Traditionally for each sample few variables are measured, for instance on a biopsy with RT-PCR only a few genes are measured, however with the new omics techniques (transcriptomics, metabolomics, methylomics, genomics), thousands of variables are measured for the same sample. This has lead to the following situation:
- More variables than samples
For a single sample of RNA around 50k genome identifiers (genes, long non coding RNAs, iRNA, pseudogenes,…) can be measured. Which leads to the case where there are many more variables than samples. Thus high-throughput data analysis typically falls into the category of \(p \gg n\) problems ( big p, little n), where the number of genes or proteins, \(p\), is considerably larger than the number of samples, \(n\). With such high number of variables the identification of the relevant variables is hard because variables will co-variate. When many variables are tightly correlated, discovering which one is important using just numerical methods is challenging. This is even more difficult when looking for causal relationships.
- More samples than variables
This was the usual case when for instance, from a cohort of patients the temperature is measured along the stage of a disease: two variables, time and temperature for each sample. If there are more than 2 patients, then the number of samples is greater than the number of variables studied. This is described in the literature as \(n \gg p\) (or big n, little p). Nowadays this is less frequent on the bioscience world, and does not causes trouble analyzing it because the high number of samples allows to accurately estimate the dispersion of variables.
There are several methods available to estimate the number of samples required [108]. Having just the enough samples for the desired statistical power, however, might not be enough in case some samples are not correctly processed.
In addition, variables might be separated on different blocks of variables. These blocks might be just of the same source or from multiple methods. Depending on the method this blocks might have special meaning: when all the data is joined in a single block it is known as superblock.
1.3.1.4 Relationship between samples
Depending on the relationship between the samples, the questions answerable and the methods that work on them differ.
A sample can have multiple or one data source, for instance we could have RNAseq and 16S rRNA (16S) data from the same sample. In a study if all the samples have all the data from multiple data sources it is a complete case. If some samples have data from some data sources but not from others the study is not a with a complete case.
Sometimes because the sample is not enough, or there are some technical or organizational problems a source of data for a sample (which is known as an incomplete case) might be lost. This results in a new source of variation that has to be dealt with, which complicates the conclusion one can draw from the studies of these kind of data.
Even when all the cases of a patient are complete the samples can come from several sites of the same individual or with different combinations of variables, which makes it relevant to understand the relationships between the different samples.
There is no easy classification of this as each experiment might be designed differently. In general, experiments are designed to be as consistent as possible but in face of adverse events that become a variation of the design the analysis complicates. Either some data is imputed or some samples are omitted for the analysis. This can happen with samples taken at different timepoints as patients for instance if they miss a follow up visit.
Time
As mentioned above, time is one of the factors that sometimes cannot be controlled, despite having programmed visits every two weeks, for instance, some patients might come early or later due to multiple reasons.
Sometimes, the objective of the study is precisely to analyze the relationships at different time, or to asses how the relationships change with time. To discover causality between two variables the cause must precede the consequence, which highlights the importance of time. Being aware of the time differences and time scales is crucial in most cases.
During in vitro experiments, conditions can be reproduced even if they are at different time. However, when using patients material replicates can not usually be performed like in vitro experiments. This makes it harder to study time-related change on patients.
Lastly, time between the collection of a fresh samples and its processing also influences the readings of the samples of the omics technology, specially RNAseq [109, 110]. Some genes are more influenced by time than others but as they are measured at the same time in all samples this might distort the data. Keeping track of the time that it takes to process samples is also hard to due and requires a highly coordinated effort [111].
1.3.1.5 Relationship between variables
Once data is collected, the next step is to understand the relationship between the variables present. As mentioned earlier, some variables influence others which can affect the outcome in complex ways. With many variables present in a dataset it is important to be aware of known relationships between variables. Even in a simple dataset, like an RNAseq dataset, it is important to be aware of the relationships between variables.
Since the discovery of the lactose operon it is known how some genes regulate each other [112]. However, it is not know how other variables are related between them. For instance, how does the increase in expression of a gene affects the growth of a microorganism? Usually the relationships between variables are mediated by many factors or interactions.
One of the best examples of such interactions is when some variables correlate. Their correlation can be used to reduce the number of variables being analyzed by ignoring the relationships between them and using the most representative variable (less widely correlated and with more variation). This step is usually done by dimension reduction methods. However, sometimes this is not desirable or feasible as the correlation does not explain the direction of the causality of the interaction between the variables (if there is any).
Network approaches relate the variables to each other [113]. These approaches are fairly new and growing in popularity partly because they can address the direction of the interaction.
In partial correlations the effect of other variables on the two being under study are taken into account [114]. They assumes a linear relationship between the co-occurring variables and those of interest. However, it is computationally expensive when there are thousands of variables.
1.3.1.6 Input data
We have classified the studies according to the data they use (as seen previously ). But, some methods to account for relationships of variables only work when a dataset is complete while other do not:
- Data from the same samples:
These methods do not handle well or at all missing data. They need complete cases/data of the samples in order to be able to integrate the results. These methods include regularized canonical correlation analysis (RGCCA) [115, 116], multiple co-inertia analysis (MCIA) [117], Multi-Study Factor Analysis (MSFA) [118], Multi-Omics Factor Analysis (MOFA) [119] and STATegRa [120].
- Data from different samples:
These methods do not need data from the same sample. They draw their conclusions generalizing from the data available. Some of them handle missing data, while others do use the data at face value. These method includes MetaPhlAn2 [121], HUMAnN,[122] and LEfSe [123].
Furthermore, some methods are designed to integrate specific types of datasets, (usually because they make some assumptions that are only met on that kind of data). For instance, HCG, 16S sequencing, RNAseq and metabolomics do not share the same data distribution, and are different between them. Also even with the same data depending on the processing of the data they can have very different properties: operational taxonomic units (OTUs) properties are not the same as amplicon sequence variant (ASV) when analyzing 16S data.
1.3.1.7 Mathematical framework
Methods use different mathematical frameworks to process the data. Here we briefly describe some common mathematical frameworks, some of which have previously appeared:
Networks
Networks methods were mentioned because they use and find information about the interaction of variables. Multilayer networks, including the multiplex, Molti-C-DREAM [124], Random Walk with Restart on Multiplex and Heterogeneous Biological Networks RWR-MH, Random walk with Restart on Multiplex RWR-M [125]. Network embedding MultiVERSE are some of the methods using networks [126].
Bayesian approaches are also quite frequent, these methods use the Bayes’ theorem to see the relationships between variables. The Bayes’ theorem explains that the conditional probability of a variable is related to the prior knowledge of conditions that might be related to the event [127]. Some methods that use these approaches are Reconstructing Integrative Molecular Bayesian Network (RIMBANET) [128] and Bayesian Consensus Clustering (BCC) [129].
Dimensional Reduction
These methods focus on finding just a few variables and summarizing them using a function that has some desired property such as the correlation between thre transformed variables is maximal while the components are orthogonal.s The selection of variables is usually done with L1 or Lasso Regression regularization technique or L2 also known as Ridge Regression. L1-regularization adds a penalty equal to the absolute value of the magnitude of coefficients which might leads to some coefficients becoming zero and the variable eliminated from the model. On the other hand, L2-regularization does not result in elimination of coefficients or sparse models and can only be used when there is multicollinearity as it works well to avoid over-fitting.
Several tools use this approach, Momix [130], RGCCA [131], mixOmics [132] and STATegRa [120]. Other methods use bayesian approches like the Bayesian Group Factor Analysis [133].
Active module identification
Multi-omic objective genetic algorithm (scores based in two metrics; node score and density of interactions score). An example of a method using this approach is Multi-Objective Genetic Algorithm to Find Active Modules in Multiplex Biological Networks (MOGAMUN) [134]
Usually depending on the mathematical framework used, these methods return similar outputs.
1.3.1.8 Output results
According to the output the integration methods can be classified in several groups:
For the network methods the following output is usually returned: Connections between the variables/nodes, a measure of how strong is the connection (or simply if there is a connection or not).
For dimensional reduction methods there are three possible outputs: Shared factor across the data, specific factors for each data or mixed factors.
- Shared factors:
Integration results in a vector of the samples in a lower dimensional space that is shared by all the data set used to integrate. Such methods include iCluster, Multi-Omics Factor Analysis (MOFA) [119].
- Specific factors:
Integration results in several vectors of the samples in a lower dimensional space of each data set used to integrate. Such methods include RGCCA [115, 116], MCIA [117] and Multi-Study Factor Analysis (MSFA) [118].
- Mixed factors:
Integration results in both shared and specific factors, to each dataset and common to all them. Such methods include Joint and Individual Variation Explained (JIVE) [135] and integrative Non-negative Matrix Factorization (iNMF) [136].
1.3.2 Interpretation
How to interpret the results of applying the different methods is highly linked to understanding the method and its output. On a correlation between two variables, the interpretation of the analysis is clear, if one variable increase, the other one too. The implications of this correlation can be far reaching but the principles to understand them are simple.
However, on more complex methods the interpretation becomes less clear. The interpretation of a canonical correlation analysis is much harder [137]. Also on more complex methods the number of parameters required increases so the time and intellectual effort to understand the relationships between the parameters is also higher.
The interpretation also helps to discuss the results and relate it to other previously know information.
- Individually:
Here we study how each variable relates to another. In the correlation analysis, the relationship between two variables under study. Or if looking by patient: how do interpret that in these patient variable A and B is X and Y?
- Globally:
In a principal component analysis for instance how do we interpret that some variables have the same loading? What happens in a more complex method like canonical correlation analysis?
There are some articles about how to interpret those methods on real datasets [138]. Others, to benchmark and to learn how to interpret propose analyzing a simulated dataset [139, 140]. Which is used to compare the results of the integration with the dataset of interest and to compare different tools. These datasets are created with some relationships that the tools are expected to find.
There exists several methods to create synthetic datasets like MOSim [140], metaSPARSim [141], CAMISIM [142], ballgown [143], polyester [144] and even edgeR [145]. These methods are useful to compare different setup but they can miss some subtle not previously reported relations on real data.
1.3.3 Reviews
The comparison and review of methods independently from original authors have become a crucial step for selecting the right tool to apply a given dataset and research question [130].
Some of these reviews focus on a specific type of data integration: metabolomics [100], genomics [11], microbiomics… Others focus on the disease and the challenges of each omics and the need of an integrative approach to provide better therapies [107, 146, 147]. On this regard there are several efforts to integrate data in IBD but no comprehensive review to date is known to the author. The most comprehensive article to date is a very recent review identifying problems and providing recommendations for future work [148].
1.3.4 Summary
The field of integration is large and complex, with increasing interest over the last few years, specially in the psychology and omics fields. As a methodology they are quite complex and diverse but there is a growing interest on them to help answer complex questions without using other complex tools like deep neuronal networks or other machine learning approaches (despite not being incompatible).
Methods to integrate have many characteristics, depending on the objectives and data that available. Regardless of the method used, interpretation and reporting is usually the main challenge.
1.4 Summary
IBD is a gastrointestinal disease that includes two different diseases UC and CD. It affects preferentially the lower intestinal tract causing lesions on the epithelial barrier. Bacteria causes or use these lesions to further damage the patients. But this interaction is also influenced by many other variables.
Data integration are methods to analyze datasets with data from multiple sources. They include a variety of methods and there are methods for several purposes. In IBD it has been used mostly sequencing data, disregarding the other variables known to be relevant.
Data integration in IBD has been underexplored despite being known that many factors interact on the pathogenesis and maintenance of the disease.