Chapter 5 Discussion
In this chapter we will summarize the main findings in relation to the broad research community and other work as well as the impact of the results on further research in or clinical practice.
5.1 Preliminary steps
The quality of the initial RNAseq and 16S data is crucial for a valid integration analysis. In sequencing data, it is very important to avoid contamination and have enough amount of data for the analysis. To avoid contamination it is very important to control the protocol used to process the samples before the sequencing. In addition control samples can be added, a blank to correct for extraneous material and a sample with known content to confirm that the sequencing worked correctly.
Our lab uses a well established protocol to isolate and sequence RNA (Described in methods’ section 3.2) and we rarely encounter problems during this phase. In contrast, DNA extraction and 16S sequencing had to be established and optimized, initially with the guidelines and support from collaborators especially Dr. Ilias Lagkouvardos. Indeed, as we encountered some problems we added blank samples to control for bacterial contamination during sample pre-processing or sequencing.
We initially processed the 16S data to obtain OTUs OTUs were the standard some years back [198]. However, OTUs are not comparable between studies even those that use the same primers. For this reason, and after a suggestion from a reviewer (on the review process of [156]), we moved to process later 16S sequencing datasets to obtain ASV. ASV allow the comparison of the taxonomic imputation between studies using the same primers. However, comparing 16S taxa ASV or OTUs is hard and selecting the right tool to compare them is important [199].
It is also worth keeping in mind that several species have variable number of 16S genes. Higher sequence counts of certain 16S might not mean higher abundance of that species compared to another with lower 16S counts. However, the exact copy number status may change even within the same bacterial species, making the correction difficult [200]. It is however possible to accurately correct for copy number variation on mock populations where the species and the genomes are known (or at least the 16S), but harder or impossible on samples whose composition is unknown. To our knowledge there is no available method yet to do this.
Furthermore, the precision of 16S sequencing for classification of taxa is not enough to understand its role in the gut. Adherent invasive cells, are bacteria share genetic content with but show different behavior [201]. These bacteria are known to be more abundant on patients with IBD [201]. Thus, bacteria with the same complete sequence can play a different role in vivo.
Most of these steps were, however, out of my control as they were performed by a lab teammate or by collaborators. Other concerns, like primers used, 16S regions amplified are currently unavoidable.
5.1.1 The datasets
There is not an established methodology to calculate the size of cohorts for interaction or multi-omic studies. Indeed, there are no clear rules on which alpha power or which kind of relations can be tested. This might be due to the lack of mathematical background and modelization of the relevant relations in biology. Further research in this area might help finding which kind of relationships can be expected given certain dataset sizes. Usually size of the datasets is determined based on practical reasons: either costs or access to patients.
There have been some efforts to create artificial multi-omic datasets [140–145, 202, 203]. This could allow benchmarking different tools, impute missing data and do pilot studies. These efforts usually focus on RNAseq, ATAC-seq (DNase-seq), ChIP-seq, small RNAseq, Methyl-seq or proteomics but not 16S, microbiome or metagenomics data. In addition, they have also focused on finding relationships between samples missing relationships within cells (regulated DNA, protein recruitment, transcription factors, siRNA regulation, etc. ) and between cells (immune response, adherence, cytokines signaling, etc.) that might surface at the sample level. To my knowledge there is no accurate artificial method to create 16S datasets or related microbiome datasets. This made impossible to simulate and compare different tools on a synthetic dataset with known relationships on this thesis to evaluate performance of different methods.
There is also no reference dataset for integration in IBD that accurately represents the disease. There is a large consortium effort with many samples [4], but this does not contain 16S and RNAseq data from the same location at the same time for as many samples as the datasets used on this thesis.
In order to validate results of methods we are limited to compare their results on different datasets. However, each dataset is collected with different goals and processed differently. In addition, authors upload their data to different, not centralized, data repositories, such as, gene expression omnibus (GEO), European Genome-Phenome Archive (EGA), European Nucleotide Archive (ENA), among others. Authors might also provide the processed data as supplementary material on their articles. Some projects whose primary purpose is providing data for the community establish their own dedicated sites to store the data [4].
There is not a resource were datasets of publications are collected with their characteristics, age, sex, sample location, extraction method, sequencing protocol, etc.. Finding different datasets with comparable data is thus challenging. Furthermore when pooling together datasets batch effect correction will most likely be necessary. There are tools to overcome this, but currently only work if the datasets share some features or samples in common [204]. These methods usually require datasets with similar RNA sequencing procedures.
In this thesis there were two in house datasets collected and sequenced: the HSCT and the BARCELONA dataset. In addition, we looked up for the most similar datasets published to confirm our results outside our own cohorts. We found several with intestinal 16S and RNAseq data from the same location, to compare with our own datasets.
As explained in the methods’ section 3.1.2, the HSCT dataset is a very unique cohort of CD patients undergoing hematopoietic stem cell transplant. This treatment is reserved to patients for which all the other treatment failed and this may be the only way to reach remission. These patients are closely monitored and followed up for several years. This treatment is not indicated for UC, so this dataset includes only CD patients.
The BARCELONA dataset (See appendix section D.1) includes samples from CD and UC collected prospectively in patients starting biological treatment and followed up for up to a year. Patients had shorter disease duration but were not refractory to biologic treatments and may even be naive to any biologic. Thus, analysis of this cohort could have provided us with a better understanding on the initial relationships between the microbiome and the mucosa of IBD patients.
Unfortunately, the 16S microbial sequence data from the BARCELONA cohort was not of enough qualtiy to make reliable analysis and confidently extract hypothesis or relationships (See appendix section D.1). It is not clear what happened and therefore we cannot hypothesize how to avoid such problems in the future. It could have been a problem with the DNA sample and/or of the sequencing process which did not include both positive and negative controls. Nevertheless, sample sequencing was repeated in an independent sequencing facility to overcome the limitations of the first dataset but problems persisted rendering this data suboptimal for further analysis.
What happened with the BARCELONA dataset highlights the importance of data quality checks.
In the BARCELONA cohort despite no batch effect as checked with experDesign on the second sequencing, the low diversity indices suggested that there was some problem with the microbiome data.
Caution and communication between all team members (i.e, clinicians, technicians and bioinformaticians) is important to discover this kind of problems and ensure the quality of the data.
Other datasets used from published sourced were assumed they had already passed enough controls and were of good quality. Nevertheless, they were screened to avoid quality issues by visually inspecting several principal components colored by several factors, checking gene expression and the microbiome profile and looking for known gene markers and microbiome taxonomy that might indicate quality problems. RNAseq data was usually compared using previously described methods on section 3.6.1.
The Puget’s dataset provided a good benchmark to test the methods and performance of RGCCA works. CGH is not comparable to microbial data, but the microarray data is similar to the RNAseq data from other datasets. We were not as much interested on the biology as on learning about the RGCCA method and its applicability to integrate different omics.
The Häsler IBD dataset was obtained using the same sequencing techniques from endoscopic biopsies as our dataset HSCT and BARCELONA.
The 16S data was very similar to the HSCT dataset.
We could confirm that the inteRmodel approach works on more than one dataset.
The taxonomy analysis of the different datasets was done differently. On HSCT following our collaborators advise we used IMNGS to annotate its microbiota data [160]. Afterwards we used SILVA database to annotate the microbiome data on their corresponding taxa.
The Morgan pouchitis dataset was also related to IBD but it included patients that underwent colectomy and samples are specific of the pouch or pre-pouch ileum. No healthy samples are included and there is no follow up. Thus, it was unlikely that a classification of the location could be achieved and that classification of the samples according to the microbiota could not be based on the disease (as all of them had undergone the same procedure and had the same disease type). Nonetheless, there seems to be a partial separation by location on the models in figure 4.25 that could partially be explained by different degrees of inflammation.
The Howell dataset includes both pediatric CD and UC (and non-IBD) samples. It is very similar to our BARCELONA dataset. As expected, time of the disease duration of these patients is lower, however, they were not followed up at different time points.
Overall, while challenging we were able to identify a few published datasets that were used to validate and compare the different models. Running such tests is essential to establish the best approach for data integration in the future an validate its results.
5.1.2 The methods
As seen in the introduction there are many different methods available and new tools and methods are frequently being released. The most up to date list of tools can be added to a collaborative list that was created with the purpose of providing access to the growing list of methodology of the scientific community. Methods differ in their quality, usage and the quality of the software. Some of them have been tested on several datasets but the most important validation process a method has to undergo is the mathematical validation.
With the increase of available analytical tools side by side comparison has become increasingly important. There are reviews that apply different tools to the same datasets [130], some are more theoretical [205], others are focused on a different area like metabolomics [100].
Few of these methods have been applied in IBD datasets. However, recently there has been a review focused on integration in IBD [148]. In this publication the authors suggest that one must be mindful of the gap between the experimental conditions and the real world. It also encourages to collect more data about the exposome (the environment patients are exposed to). It ends up advising to set up guidelines for multi-omic studies tailored to the field, coordinate a global framework to prevent redundant studies and to ensure efficient funding and resources and disseminate training and education on computational approaches to analyze multi-omic datasets.
Current methodological approaches focus on comparing tools on (several) previously published datasets [130], an approach that we have taken too. This approach was not used to compare different tools, but to validate findings of one dataset in other datasets. This is especially important due to the lack of golden datasets or a way to reliable simulate datasets as discussed on the previous section 5.1.1.
In IBD, many studies focus on finding some genes or bacteria to answer a narrow question they have in mind, like which bacteria are related to inflammation [81] or disease activity. In this thesis, the focus was on finding a good representation of the relationships that identify groups of genes and bacteria that were relevant to the disease in an orchestrated manner. We made the assumptions that the microbiome composition and the host’s transcriptome were related. This assumption is backed up by several other previous studies supporting this relationship [41, 42, 206–208].
Tools that relate the variance of a block with other variables, both numeric and categoric, are needed to search which variables are important.
PERMANOVA and globaltest served that purpose, but they do not give any insight into which specific microbial species are driving the association between the microbiome and the variables [209].
In addition, we could be missing some other important variables.
It is known that other factors beyond the omics data collected, mainly environmental factors, genetic susceptibility and the immune response may play a role [210].
Sudhakar et. al. [148] recommend being conscious of the gap between the data available and the biological process.
One variable we did not keep track was the microbial load which is linked to the gut’s microbiome community variation [211].
This needs to be quantified at the time of DNA isolation and most studies, including our own lack this data.
We tried to find which genes and bacteria are correlated between them using WGCNA, a tool designed to find common co-occurring patterns based on correlations.
It requires homogeneous samples, with a minimum of 12 samples per condition.
However, when applied to the whole dataset there might be too much variance in order of WGCNA to find the proper signal.
As we have patients of different ages and samples from different intestinal segments, both variables are highly related to the intestinal microbiota, this might be the reason why this method failed to achieve a good fit on the scale free topology with around 100 of mean connectivity.
In addition, having microbiome and RNAseq in the same matrix, would probably be hard for the process to find good relationships if we applied the same normalization process to both of them without escalation.
We could have tried to make smaller groups and then compare the modules between them but groups may have been too small since samples were from multiple segments and conditions.
We briefly considered using STATegRa.
However, it is not possible to model specific interactions between blocks.
The method implemented on STATegRA might be useful for cases where there is a great agreement between blocks or were environmental factor do not play a huge role on any of the blocks of data.
To identify related variables other methods use correlations between the variables [212]. On our dataset we visually explored the correlations for all the datasets, but the significant correlations were usually driven by an outlier, or there was not a good fit of the data due to missing data (data not shown). We tried filtering those correlations identified by the models, being less restrictive by removing those samples that did not have microbiome presence on at least 5 samples, and removing those samples without that microbiome presence, separating based on intestinal segment and a combination of all. None of these variations provided a clear insight over which genes were correlated to which bacterial signatures. This is in contrast to other publications that relied purely on the Spearman \(\rho\) metric [80].
We developed and applied BaseSet to find these relationships using a different approach.
However, it failed because it is computationally expensive to calculate the likelihood of 1500 variables; there are too many combinations.
In addition, the numeric precision of said calculations suffers from the floating point problem and must be carefully considered [213].
To support multiplying more than 1000 float numbers a different strategy such as using log values might be better.
We could not come up with a better strategy to find all the combinations needed, perhaps a better method exists that could be used to find which are the terms more influential to the end result.
During the peer-review process of the package for its acceptance on rOpenSci, some concerns were raised about conflating probabilities with fuzzy-sets.
For all these reasons this approach was no longer pursued.
However, the package was mentioned as top 40 packages added on CRAN that month and it will be useful under other circumstances or when less combinations are possible.
The development of the experDesign package helped us to avoid batch effects on the sequencing step.
However, as seen in the previous section, batch effects were not completely prevented.
As discussed in the related publication [194], there are several tools already focused on this problem: OSAT ([214]), anticlust ([215]) and Omixer ([216]).
But these tools have some shortcomings, that are covered by experDesign: OSAT cannot handle missing values and does not work well for arbitrary batches, anticlust only accepts numerical variables but it is based on a powerful mathematical theorem and Omixer has bugs that prevent comparing with the other tools with no possible workaround.
In addition, experDesign received requests to have a new feature for expanding experiments.
This might help improve the quality of bigger datasets to ensure they can be extended in several sequencing runs.
This feature would be useful for multi-omics datasets or in big cohorts to minimize batch effects associated with long running collection of samples.
We selected MCIA as a baseline to compare our method because it works well on a wide range of datasets, has a good documentation as well and it is widespread used.
The method was developed after RGCCA and recently there have been publications that show that it outperforms other methods on its versatility on different contexts [130].
On the dataset analyzed we found that it performed similarly to inteRmodel but this will be discussed on section 5.3.
5.2 Designing models
Previous publications using RGCCA in IBD have focused on validating genes DUOX2 and APOA1 as inflammation predictors ([81]) from previously published articles [217].
Some publication tried to summarize the existing relationships in IBD [80], but none were focused on finding the relationships in IBD using RGCCA as we did.
There are many variables outside transcriptomics and the microbiome that may be relevant in disease homeostasis.
These variables should be included on the models to find which genes and bacteria are truly related and not confounded by other factors.
In addition, the relationships between the blocks are unknown on both the strength and interaction.
To model the relationships the connections between blocks had to be selected on RGCCA.
Last, the variables that belong to a block should be carefully considered as the assumption is that the whole block is correlated with other blocks connected.
If one has preexisting theories about the data, a specific model can be used stating these known or hypothetical relationships. However, if new relationships are being explored or no prior assumptions on the data are held the models should be created with random links between blocks, and evaluate which model is better.
The connections tested required that all models should have all blocks indirectly connected to other blocks with no blocks left unconnected. This avoids optimizing two different networks of blocks that are not connected between them, thus, forcing the model to represent all the information.
Typically blocks are defined by each omic data origin and no other information is included. However, we knew that the transcriptome is mainly related to the location of the samples, as we have seen it on the PCAs, and we expected that the microbiome would be more related to the patients demographic characteristics and influenced by dietary and other environmental factors. This is especially important because in our datasets we have samples from the same patient and time from multiple locations. On other studies there are less samples per individual and timepoint (if there are several timepoints) [80, 150, 151].
On models of family 2, variables were grouped according to type into the Demographic block, Time block, and Location block (see tables on design of Puget’s 4.4, 4.3; HSCT 4.13 4.14, 4.15; Häsler: 4.21, 4.22, Morgan’s 4.28, 4.29, Howell’s 4.34 models).
The exploration of design on Puget’s dataset, and the datasets analysis of HSCT, Häsler and Morgan’s datasets was published after peer review [156].
5.3 Evaluating models
To evaluate a model RGCCA provides the inner and outer AVE; (see section 3.3.1.2).
As the inner AVE measures how good does the data fit in the model, we used it to evaluate and compare the models.
Furthermore, bootstrapping was used to evaluate the fitness of a design on a diverse collection of datasets.
Although on inteRmodel there is the option to use a leave-one-out procedure, we did not use it to evaluate the fitness of the models.
Using an external cohort to validate the same model, or using a different method to see if it finds the same relationships or explains the data as accurately is also a common approach to evaluate and validate models. Using the same approach on different data helps to ensure the replicability of the results [218].
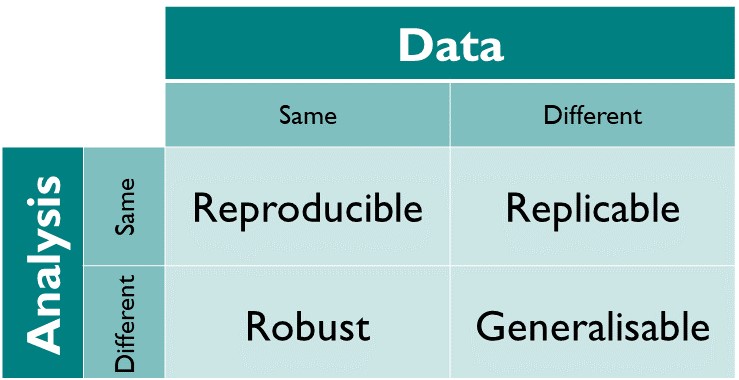
Figure 5.1: Reproducibility matrix indicating the terminology used between using the same method and the same data. Figure from The Turing Way: A Handbook for Reproducible Data Science (Version v1.0.1).
We used the same approach on four different cohorts, with different origins and types of samples, but all related to the IBD popultation including 16S data and intestinal transcriptome. Some of them have multiple samples from the same individuals while others do not [80].
We also compared our method with a different one to see how generalizable are the results.
Of the multiple methods available we used MCIA [219].
We compared it with inteRmodel by looking at the area under the curve for classifying the samples with the canonical component of the transcriptome data according to their location.
The procedure of separating independent variables in their own block of data and later search the best model that fits the data provides a good strategy that should be considered for integration efforts.
The procedural method of searching a model and testing it is implemented on inteRmodel.
But the most important thing is to consider which variables are independent of which and if they can be separated into a block for later usage on the modeling (See [220]).
If not done properly it can lead to undesired conclusions like the effect known as Simpson’s paradox [221].
Unfortunately this cannot be automated and it is left for the practitioner.
Splitting the variables of each sample into several blocks forces RGCCA to adjust for a new canonical dimension.
The omics block such as gene expression and 16S data could be split, as the expression of some genes influence other genes, such as transcriptor factors (First mentioned on [222]) , miRNA [223], and siRNA [224].
All these interactions and regulations could distort the canonical correlations.
However, the nature of this relationships is not linear and the interaction between them is multiple and very complex.
Its complexity has prevented to accurately account for all subcellular reactions at speeds that could be useful (it has only been recently accomplished for a prokaryote cell [225]).
In addition, these interactions are time dependent, not linear and are highly interconnected between many variables.
For these reasons gene expression and 16S blocks were not split into several blocks.
Besides comparing the results of different methods, these models need to be evaluated by the insights they provide on the biological system they are being applied to, in our case IBD. So far the models were only discussed on their technical merits.
It is known that the mucosal transciptome is related to sample localization (i.e. small or large intestine) and disease activity [226]. This can be seen in the PCA which separate colon an ileum on the first dimension: See the PCA figures of the different datasets 4.9, 4.18 and 4.30. The difference is so great that many times the colon and ileum samples are analyzed separately. As such, it was a reasonable assumption to expect models to reflect these differences on the gene expression canonical component.
The variability of microbiome difficults finding clear patterns (See the PCA figures of the different datasets: 4.8, 4.17, 4.23 and 4.29). In healthy humans, it has been suggested that there is a shared microbial patterns among groups of individuals [227]. Such theory proposes three groups of similar microbiota composition, named enterotypes. However, the enterotypes classification is not unanimously accepted [228, 229]. Some suggest it is an artifact of the methodology used.
There are many factors that influence the gut microbiome [230]. But the role of microbiome in IBD has gained a lot of attention in the last 10 years [17, 231, 232]. The microbiome has been associated for instance with treatment response in CD and suggested it could be useful for building an improved classifier for CD [233].
In addition, it is known that microbiome of patients in remission is different from non-IBD patients [234]. So even if two people are apparently healthy at a given time their microbiome might not be similar.
The relapsing nature of IBD, suggests that at different time points the gene expression or the microbiome might be different. For this reason, time is an important variable when modelling the disease. If samples at multiple timepoints are available the time difference should be taken into account to identify the state of the disease for each patient. Even in healthy non-IBD patients, multiple samples with microbiota from the same patients could provide common microbiome signature, which can help identify altered microbiome states later on.
Of the cohorts analyzed in this thesis, the HSCT and the Häsler dataset are the only ones including time related variables. However, the Häsler dataset only had age at date of sampling, and there were not several samples for the same patients at different timepoints. This leaves the HSCT dataset as the only one with multiple timepoints from the same patients. Having that many samples from the same patient might explain why the classification of the disease on this cohort works so well, despite being a cohort of complicated patients with several background treatments, refractory to all previous treatments, some of them having undergone surgery too and undergoing severe immunosupression during follow up. Despite all of this, there was large agreement in the genes and pathways identified as relevant between datasets (See figure 4.35).
Comparing the microbiome between datasets is less straight forward. If the same primers are used the ASV could be directly compared. However, the ASV’ length might be different. In addition, in this thesis we used dataset obtained with different primers and also OTUs For these reasons a direct comparison is not possible. A comparison of the taxonomy of the annotated microbiome on the datasets is the next possibility.
However, some datasets used did not provide the annotation (Häsler’s and Morgan’s datasets). So we are are left with comparing OTUs (HSCT dataset) with ASVs (Howell’s). Despite the errors on ASV annotation ([235]), OTUs from the HSCT dataset can be compared to ASV from the Howell’s dataset. There were very few common taxonomic levels selected on both datasets (data not shown). This was not a surprise, as there are many factors that influence one’s microbiome profile and the diversity indexes already showed high differences between samples of the same dataset.
The microbiome of each dataset seemed capable to classify the samples according to the disease (data not shown). However, on further evaluation via bootstrapping this classification was not significant, as different relatively big amount of ASVs were able to classify the samples. This might be due to the uniqueness of microbial composition to each sample.
In Howell’s and Häsler dataset, the best model based on AVE is 1.2; which separates the microbiome component by location too (See figure 4.20 and table 4.23 for Häsler dataset and figures 4.31 and table 4.35 for Howell dataset). The 2.2 models according to the inner AVE were not that far away from models 1.2. This indicates that the relationship of the microbiome is stronger than with the location, but both factors should be considered when looking for relationships of genes with microbiome.
5.4 Implications
On this thesis several methods has been developed to help multi-omic data integration.
experDesign was implemented during the initial steps when moving from bench to in-silico analysis.
BaseSets and inteRmodel are useful for computational analysis.
BaseSets might help beyond integration analysis such as single cell annotation9.
Some studies using host transcriptomics of fecal wash infer inflammation without colonoscopy [236]. This would help patients to avoid an unpleasant experience, and reduce the usage of clinical facilities. It could be possible that just sequencing the intestinal microbiome could be enough to identify the patients’ disease. However, this requires further validation to ensure that the diagnosis is accurate enough on a diverse and big population. There are already studies on this direction, not only for IBD or intestine but for several different human regions [4].
With our studies we hoped that we would provide which bacteria played a role on the disease, or which genes and bacteria are related in IBD.
We obtained a list of putative genes and bacteria but not a clear pairing of which genes interact with which bacteria.
This could mean that the microbiome community is related to all the genes.
It could also mean that the methods are not powerful enough to find more tailored relationships as normalizations and generalizations present on RGCCA do not allow to subgroup or classify the variables already detected.
Maybe a different method that would not depend on the same principles might be able to detect finer relationships on the variables selected.
There is a disconnect between the computational side and the experimental side, driven by the difficulty to design and perform an experiment to test the new information that multi-omic experiments provide. This is referred as the gap in other publications [148]. Closing this gap between the computational methods and the data origin and practical usages would potentially require closer collaboration between clinicians, statisticians, bioinformaticians and research software engineers; in addition to creative ideas accounting for the standard procedure on hospitals and points of care.
However, it is also possible that further developments or creatively applying statistical methods might help closing the gap. For instance, there are many combinations of possible interactions. These interactions between microbiome and genes are currently hard to explore statistically. Further research on how to reduce the space of possible combinations of bacteria or evaluate which combinations are more important might be useful on the future. This might involve using more network integration methods.
Krassowski’s et. al. ([95]) advise on software engineering and reproducibility practices to share awareness with new researchers in multi-omics for end-to-end workflow. In addition the recent recommendation about integration in IBD ([148]) suggests that there is still much to be done to increase the results on these projects and the effectivity. We agree with them and encourage other researchers to carefully consider the proposed methodology before starting their own projects.
There seems to be a tendency of multi-omics projects to focus on metagenomics, metatranscriptomics and metaproteomics and abandon plain 16S sequencing [237]. This could be explained by the numerous problems that 16S sequencing has. Some of these are avoided or solved by using these other omics techniques. For instance the metatranscriptomics and metaproteomics of bacteria could help detect what is actively being produced by the microbiota and the metagenomics, what genes are actually there not just restricted to 16S sequences. But these methods also have their shortcomings. Metagenomics still does not detect adherent invasive cells and metatranscriptomics and metaproteomics can not explain which bacteria is expressing which genes (even if paired with metagenomics or 16S data). The single cell revolution might provide more insights in the future, but at the moment the first studies of single-cell multi-omics are being published.
Perhaps as suggested in other publications network methods might be able to provide more detailed information about the relationships [238]. But, it is unclear how complete and valid these networks are. Current literature focus on already known and studied genes instead of on more novel and with higher relevant genes [239]. By extension, this translates in bias in networks and pathways resources available for pathway analysis and integration methods. This could explain why there are many genes selected by the models with few pathways or gene sets.
To study complex systems, new technologies like “organ-on-chip” or more specifically “gut-on-chip” are being developed [240]. These systems expand on the already useful technique of using organoids to better mimic the epithelial cross-talk in the laboratory. Latest developments include the addition of separate environments and distinct flow on these environments. By introducing gut microbiota, these systems will help studying the interaction of the gut microbiota and the intestinal epithelium. However, it is not clear how accurately account for other factors such as the presence of inflammation.
In summary, as shown with the PERMANOVA approach, several factors affect the disease and the relationship between gut’s microbiome and gut’s mucosa. Analysis or comparisons without taking them into account might provide misleading or false results. To our knowledge this is the first study using these variables as part of the integration study with canonical correlations. We hope this provides a first approximation to accurately understand the relationships between genes and bacteria in IBD.
References
See an exploration of this using AUCell https://bioconductor.org/packages/AUCell on this website: https://llrs.github.io/BaseSet_scRNAseq/AUCell.html.↩︎